The October 2026 market chart for Rancho Palos Verdes condos and townhomes calls the month a buyer's market. That label rests on months of inventory, which hit 8.0 in October 2026. It was 4 in September and 2.5 back in April, the lowest reading of the past 15 months. Behind that 8.0 are just three closed sales. Every condo and townhome sale in the city in October 2026 would fit in a short paragraph.
The attached-home market in Rancho Palos Verdes is small enough that its headline statistics often describe which buildings sold rather than how the market moved. If you're comparing Peninsula options and weighing a condo or townhome here against a house, the steadier signals are the counts that sit underneath the averages.
How three closings turned into eight months of supply
Months of inventory is a simple ratio. You take the homes for sale and divide by the homes that sold that month. In October 2026, the TrendGraphix chart of CARETS data shows 24 condos and townhomes for sale in Rancho Palos Verdes and 3 sold. Twenty-four divided by three is eight.
In September 2026 the city had the same 24 listings and six sales, which works out to four months. The number of homes for sale didn't change between September and October. Closings fell from six to three, and that alone doubled the supply figure.
Pending sales are the more useful forward signal. Seven condos and townhomes went under contract in October 2026, up from two in September and six in October 2025. In a month with three closings, seven new contracts say more about current buyer demand than the closing count does.
Fifteen months, side by side
The chart's monthly figures read more clearly in a single table. The counts and averages below cover Rancho Palos Verdes condos and townhomes from August 2025 through October 2026.
| Month | For sale | Went pending | Closed | Average sold price |
|---|---|---|---|---|
| Aug 2025 | 34 | 7 | 6 | $1,070K |
| Sep 2025 | 35 | 5 | 6 | $879K |
| Oct 2025 | 36 | 6 | 7 | $872K |
| Nov 2025 | 33 | 4 | 5 | $1,051K |
| Dec 2025 | 26 | 4 | 4 | $819K |
| Jan 2026 | 28 | 11 | 8 | $622K |
| Feb 2026 | 24 | 5 | 6 | $1,162K |
| Mar 2026 | 22 | 8 | 6 | $813K |
| Apr 2026 | 25 | 8 | 10 | $1,030K |
| May 2026 | 28 | 9 | 8 | $870K |
| Jun 2026 | 20 | 7 | 7 | $906K |
| Jul 2026 | 21 | 5 | 7 | $840K |
| Aug 2026 | 22 | 4 | 3 | $990K |
| Sep 2026 | 24 | 2 | 6 | $890K |
| Oct 2026 | 24 | 7 | 3 | $961K |
In no month did more than ten condos or townhomes close. Between January and February 2026, the average sold price went from $622,000 to $1,162,000, an 87% jump in four weeks. No housing market reprices that fast. That swing came from the mix of homes that closed.
The average price is mostly a report on which buildings sold
The city's condo stock explains the swings. The Los Angeles County Assessor's roll lists 20 condominium projects of 20 or more units in Rancho Palos Verdes, 1,286 units in all. Most were built between 1964 and 1979. Two projects are much newer: 28 units at 28220 Highridge Road, built in 2015 and 2016, and the 60-unit Sol Y Mar Condominiums, built from 2016 to 2018.
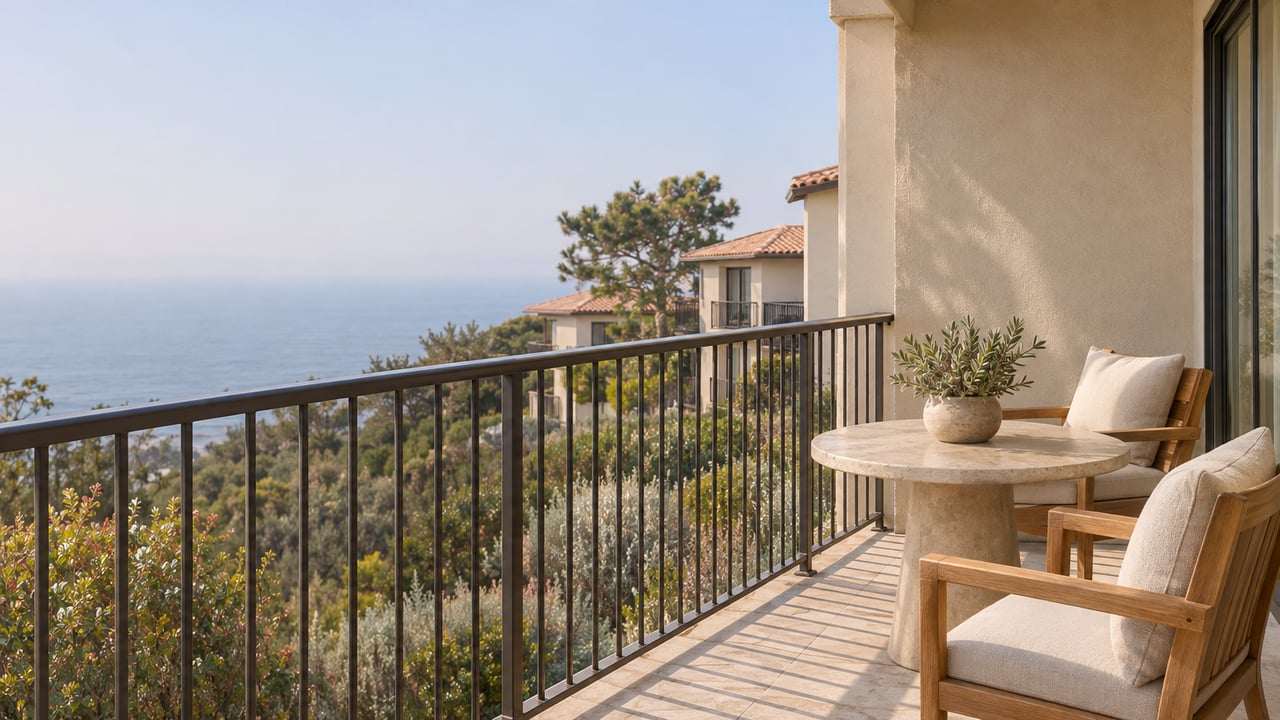
A single complex makes up a large share of that total. The Palos Verdes Bay Club, at 32821 Seagate Drive, has 240 units on 18 acres overlooking the Pacific and Catalina Island. Its amenities include two heated pools, two spas, two tennis courts, a gym, a game room, a Social Hall and a private path down to the rocky shore. The Assessor's roll lists it under 32700 Coastsite Drive, and it holds nearly one in five of the city's large-project condo units. The other large projects are spread across the city: 167 units at 6542 Ocean Crest Drive, the 100-unit Ocean Terrace Condominium Association at 3200 La Rotonda Drive, 98 units at 5927 Armaga Spring Road, 78 units at 28501 Vista Madera, and the 70-unit Eastview Townhouse Owners Association at 29641 S. Western Avenue. Ocean Terrace is one of the associations in the RPV Council of Homeowners Associations, which lists more than 30 member HOAs representing over 4,000 households.
A 1960s unit on Western Avenue, an oceanfront unit at the Bay Club and a unit at a project finished in 2018 are different products that sit in the same category. When a month has three closings, a single sale from one end of that range can move the average by six figures. October's $961,000 average sold price is up 10.2% from October 2025 and up 8% from September 2026. Three sales can't tell you whether condo values in Rancho Palos Verdes rose 10% in a year.
The asking side points the other way. The average price of active condo and townhome listings was $803,000 in October 2026, down 7.8% from a year earlier and down 1.2% from September. Sold prices rising while asking prices fall is the pattern you'd expect when a handful of higher-end units close and the rest of the inventory stays listed. When you compare buildings, recent sales inside the same complex are worth more than any citywide average.
Listings are the number that holds still
The for-sale count moves more slowly and is harder to distort. Twenty-four condos and townhomes were for sale in October 2026, down 33.3% from 36 in October 2025. Across the 15 months in the table, listings ran from a high of 36 in October 2025 to a low of 20 in June 2026, and they have stayed between 20 and 28 every month since December 2025.
Put the three steady numbers together for this October and the market is tighter than its label. A third fewer homes were listed than a year ago, and pending contracts were above their October 2025 level. Only the closing count fell, and with one more closing the October reading would have been 6.0 months instead of 8.0. If you're looking at a condo or townhome on the Peninsula this winter, expect a small number of choices at any given time. Each listing will be measured mainly against other units in its own building.
What the gap to a house looks like this fall
The single-family market in Rancho Palos Verdes runs on far more volume, and its averages are steadier for that reason. The average sold price for a single-family home in the city was $2,281,000 in October 2026, up 8.7% from October 2025. The average active single-family listing was priced at $3,555,000 in October 2026, down 2.9% from a year earlier.
On October 2026 averages, a condo or townhome in Rancho Palos Verdes sold for about 42% of what a single-family home sold for. Both property types posted average sold prices higher than a year earlier, and both had lower average asking prices. Given how few condo sales stand behind the condo figures, that ratio is a rough guide to the gap between the two markets rather than a measured price.
If you're also weighing the city's single-family neighborhoods, our earlier look at how the landslide-adjacent areas price and finance differently covers that side of the market. Buyers comparing attached homes elsewhere in the South Bay can read our condo, townhome and house comparison for Redondo Beach next to this one.
If you're deciding between two buildings or comparing a condo with a house this winter, Janet Chen Group can go over recent sales in the specific complexes you're considering with you, in English or Chinese. Request a personalized consultation and free home valuation, or read more about the city on our Rancho Palos Verdes neighborhood page.